Author of the thesis: Elisabetta Bertola López
Director: Francisco Cabello Luque
Faculty of Psychology, University of Murcia
From ARASAAC we want to show our gratitude to Elisabetta Bertola, Francisco Cabello and the University of Murcia for the work done throughout this thesis that is the first comparative research with scientific evidence on the validity and use of the pictograms of the Aragonese Center of Augmentative and Alternative Communication .
Likewise, we congratulate the author and her tutor for obtaining the highest grade in the presentation of this thesis.
***************************************
What is published on this page is a SUMMARY of the thesis. You can access the complete thesis through the Digitum page of the University of Murcia from this link:
Doctoral thesis “Empirical analysis of the formal characteristics of the pictographic symbols of ARASAAC“
***************************************
For more information you can also contact the director through the email fcabello@um.es
Introduction
Augmentative and alternative communication (AAC) uses different symbol systems to enable communication, which are usually divided into graphics (photographs, pictograms or drawings) and gestures (signs and manual gestures).
Among the first, one of the most used are pictograms, which are defined as non-vocal signs of graphic type in which there is some physical and real relationship with the concept represented. As Carmen Basil points out in the section “What are augmentative and alternative communication systems?” of this website, pictograms “have the advantage of allowing from a very basic level of communication, which adapts to people with low cognitive levels or in very early stages, to a very rich and advanced level of communication”, so it is not surprising that numerous sets of pictograms have been developed in recent decades, such as those of the SPC system, the Bliss system, those of Picsyms, widgit or those of ARASAAC.
Given this variety, the question arises of what criteria to use to choose between the different options when implementing a set of pictograms for a specific child. And from the point of view of research, the most relevant variable is the so-called “iconicity”, which consists of the degree of relationship that an individual makes between a symbol and its referent, and which has been proposed as a continuum. At one end would be transparent symbols, which are those in which the meaning and symbol maintain an obvious relationship, while at the other end would be opaque symbols, which are those in which there is no relationship between the symbol and the referent.
The importance of iconicity arises precisely because it has been proposed that the greater the transparency of a set of pictograms, the easier it will be for users to learn, something widely demonstrated in the scientific literature. It is therefore not surprising that two of the most relevant researchers on AAC, Mirenda and Locke, stated in 1989 that all sets of pictograms should be validated and iconicity data available.
Although the pictographic symbols of ARASAAC are used in a multitude of materials, communication notebooks or computer applications, however we still do not have data referring to their iconicity and degree of transparency. This thesis has wanted to fill this gap of evidence and carry out the systematic analysis of the iconicity and transparency of ARASAAC. More specifically, the objectives that were set were the following:
- Establish the degree of iconicity of the ARASAAC symbols in different populations (adults with normal development, children with normal development, and children with developmental disorders).
- Analyze the influence that different grammatical categories could have.
- Study possible factors that are considered relevant.
Structure and experimental task
To cover these objectives, a total of seven empirical studies were carried out divided into two blocks, the first of them focused on the iconicity and degree of transparency of the ARASAAC pictographic symbols in three different populations (adults with normal development, children with normal development, and children diagnosed with autism spectrum disorder). The second block, on the other hand, analyzes important aspects identified in previous studies such as the influence of the use of color in pictograms or the difficult effects of symbols.
In these studies, a task based on the previous works of Mizuko and Reichle (1989) was used, in which words corresponding to different grammatical categories (nouns, verbs, adjectives and linguistic elements) and also to three sets of different pictograms (ARASAAC, SPC and Bliss) were selected. For each of these words a group of 4 pictograms was presented, each of which contained the pictogram of the target word and three distractors. For example, in the following figure we see the group corresponding to the symbol “CAMA”. In this case, bed would be the target symbol, while chair, sofa and shoe would be the distractors.
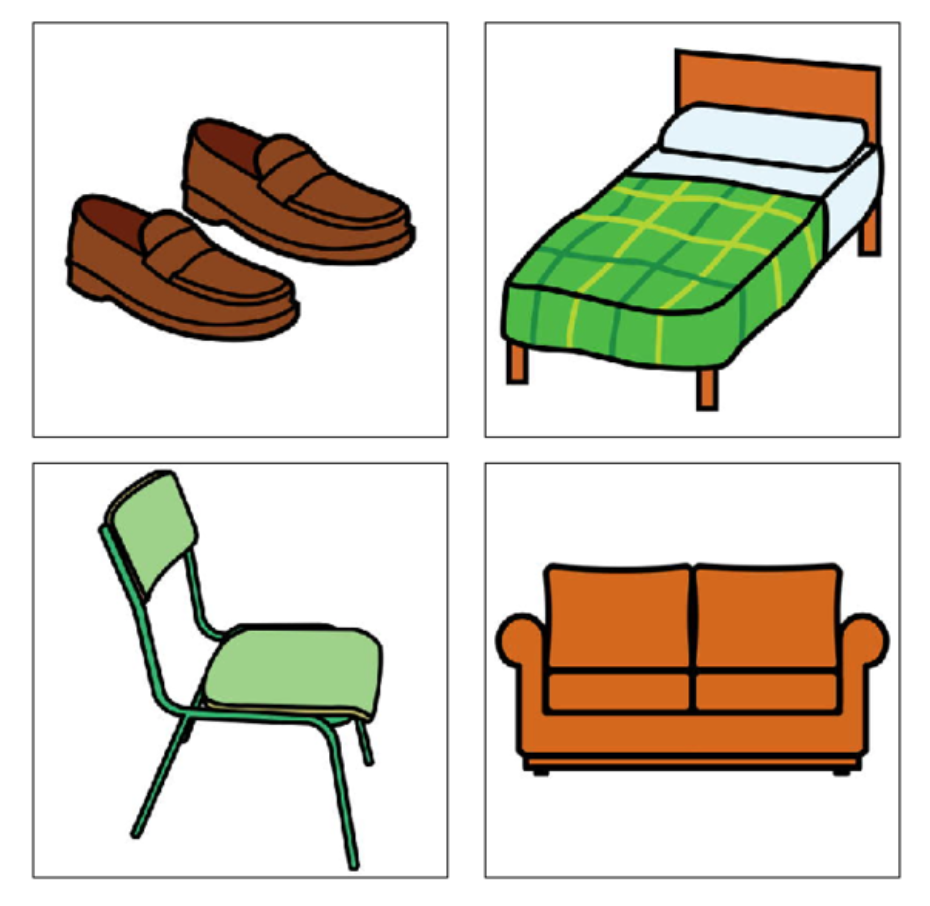
The task of the participants was always to click with the mouse of a computer on the pictogram that corresponded to the word that was displayed.
Results
Regarding the results of iconicity, a graph is presented for each of the three populations studied.
The first graph shows the iconicity data for the population of adults with normal development, taking into account that a value of 1 meant that the participant identified the meaning of all the pictograms, a value of 0.5 that identified half of the pictograms, and a value of 0 that did not identify any pictogram.
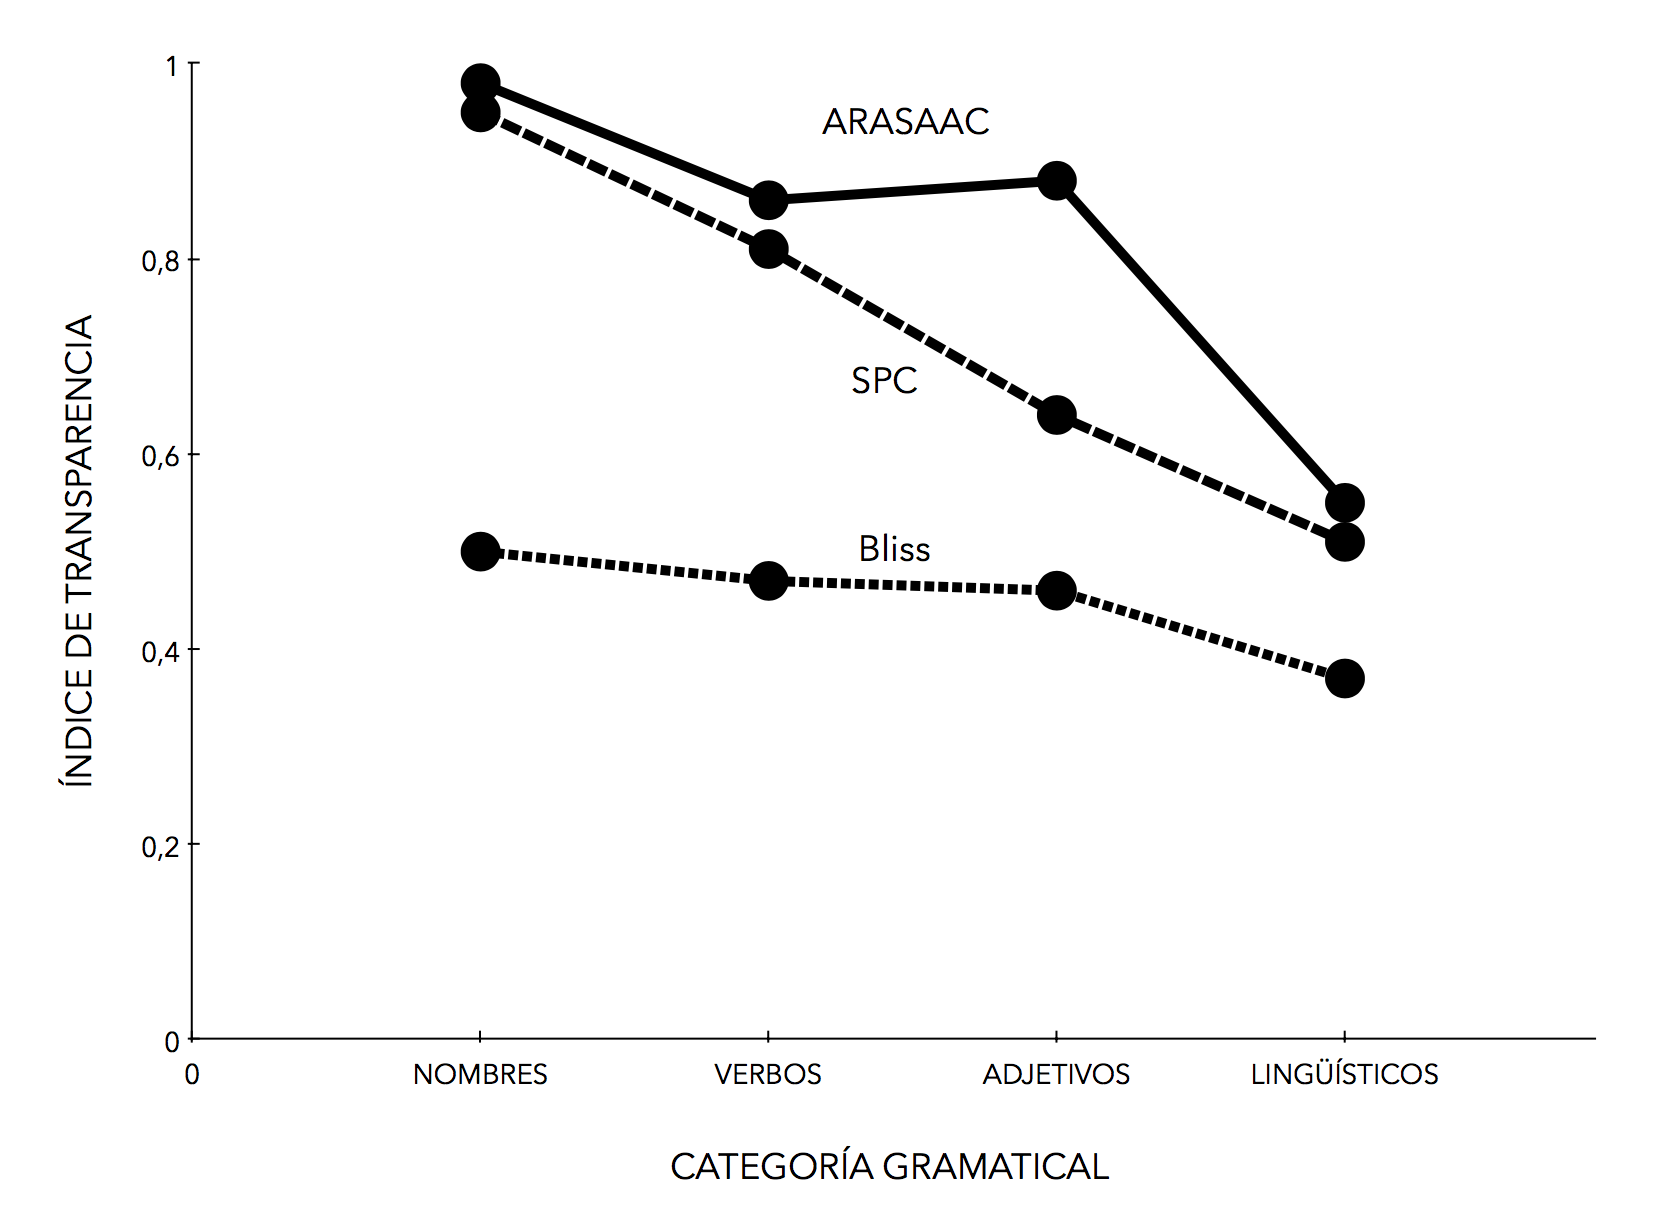
As can be seen, the ARASAAC set was the set with the best iconicity for all grammatical categories, obtaining significantly higher indices than SPC and Bliss. For its part, SPC also showed better transparency in all categories than Bliss, which always obtained the worst values.
As for the population of children with normal development, the second figure shows the data of iconicity in a group of 45 children of Infant and Primary.
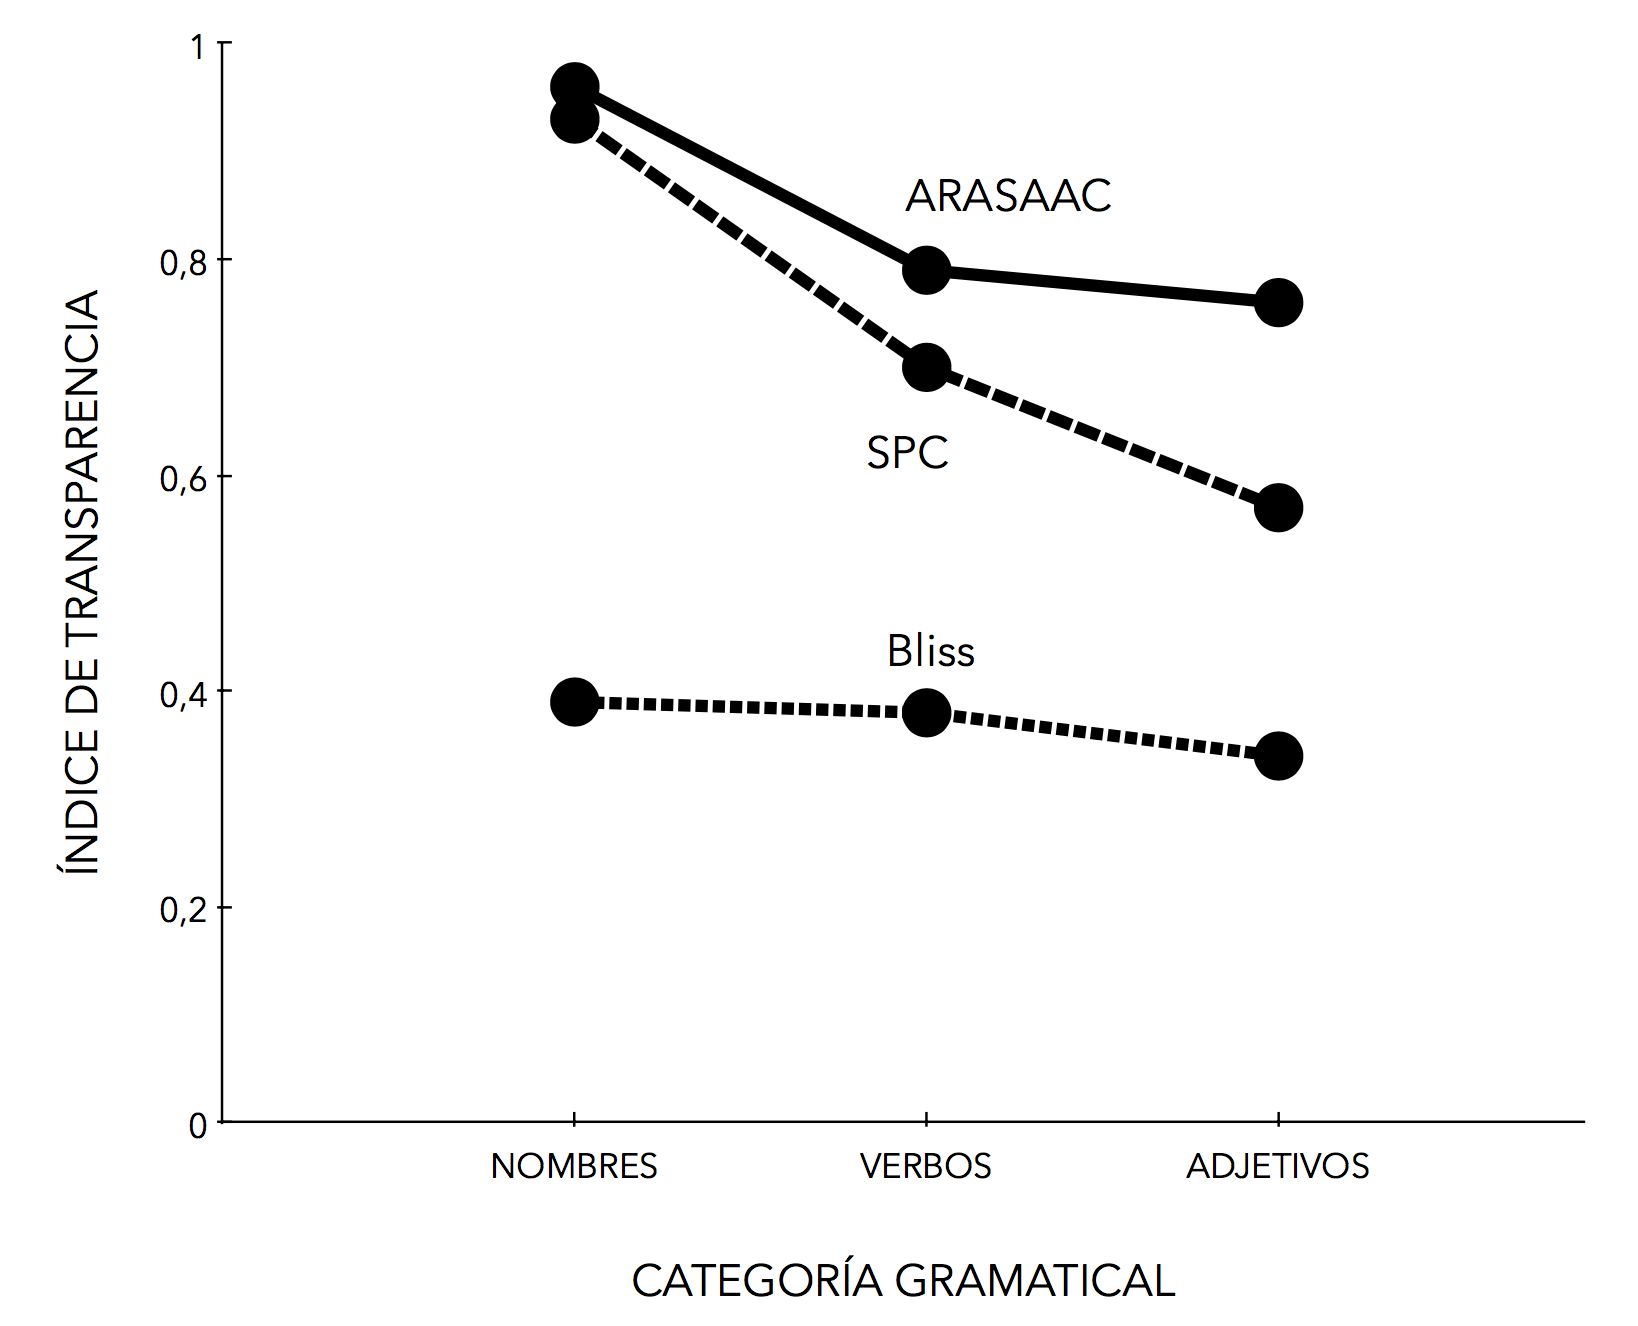
The results again indicate that the ARASAAC set turned out to be the most transparent for all categories, achieving a significantly greater iconicity than SPC and Bliss. At the same time, SPC also achieved higher transparency values than Bliss, which performed the worst for all categories.
Finally, the third figure corresponds to the population of children with autism spectrum disorder, which is one of the groups where pictographic signs are usually used as facilitating elements of communication.
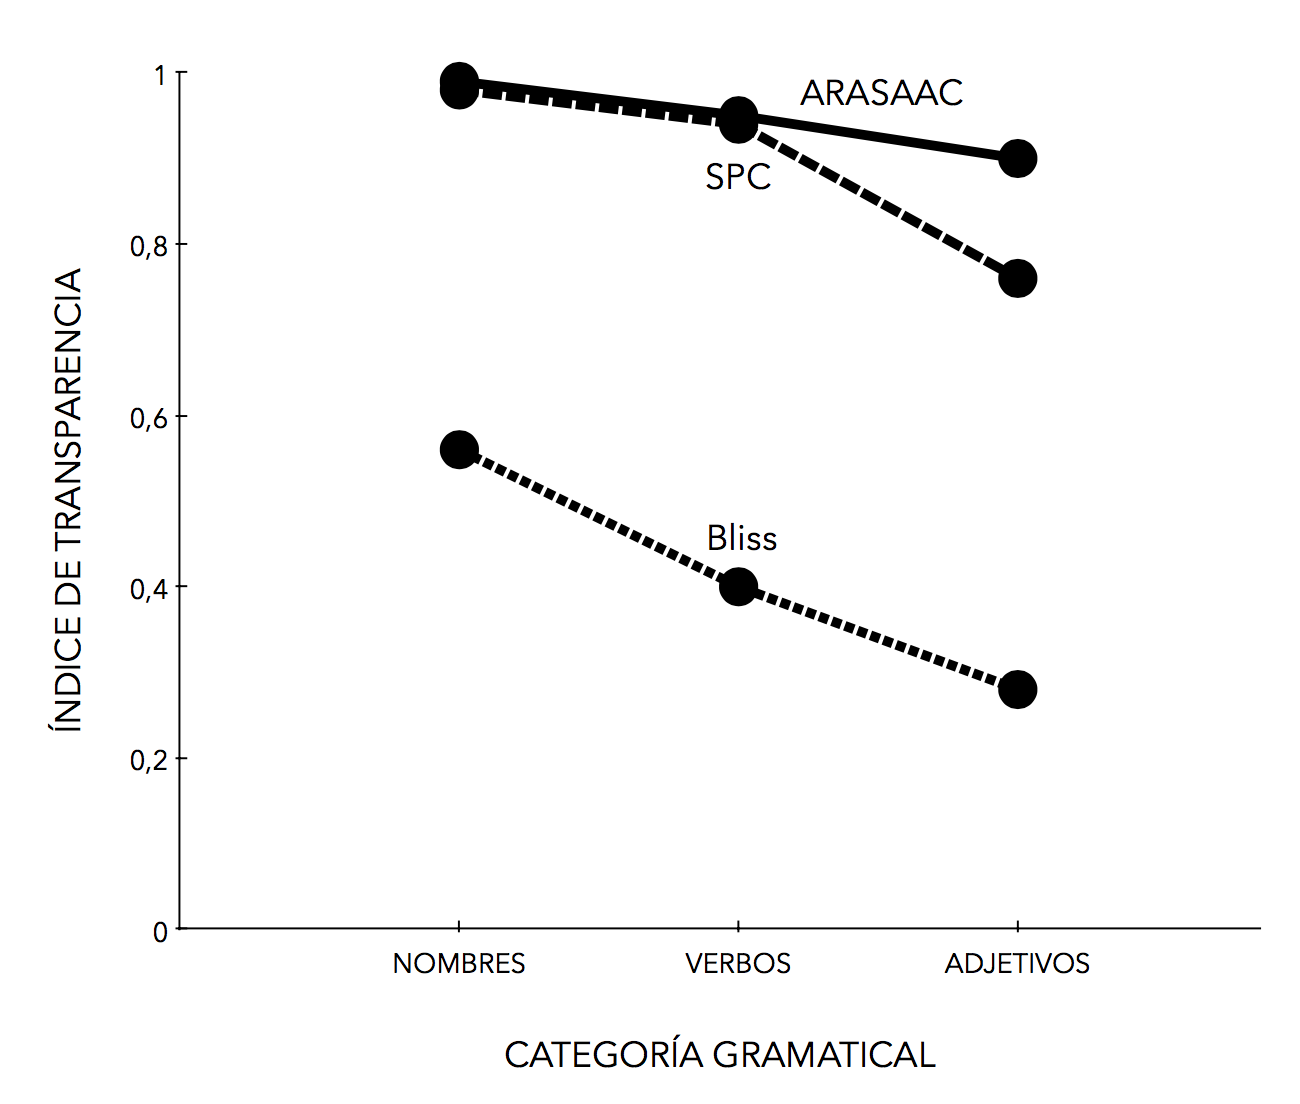
As in the other groups, ARASAAC showed the highest index of iconicity in the three categories. However, this time those differences were not significant in nouns or verbs, only in adjectives. Bliss, on the other hand, showed the worst results of transparency.
Other relevant results of the thesis, which are not detailed in this summary, would be related to the importance of grammatical categories, the absence of differences in iconicity due to the use of color or black and white symbols, or the existence of important differences even between symbols of the same grammatical category.
Conclusions
As mentioned above this thesis yields the first data of iconicity and validation of the pictograms of ARASAAC. With all the usual precautions, these findings are very positive since the pictograms of ARASAAC show a high level of transparency, which also significantly exceeds those obtained for the SPC and Bliss sets in all the populations studied.
These results do not imply that ARASAAC is the best set of pictograms in absolute terms. On the contrary, the selection of one type or another of symbols will always have to adapt to the needs of each person, to their age, and to their motor, cognitive and linguistic skills. What this thesis provides is a sufficiently solid basis that demonstrates that ARASAAC pictograms possess adequate formal characteristics and that their meaning is easy to guess. Therefore, ARASAAC is not only a set of symbols freely and freely available, but they finally have evidence to support their use.