Authors
Roldán Coya, Jonatan Walter
Viera Delgado, Beatriz
University of La Laguna
Alonso Rodríguez, M. Ángeles
___________________________________________________________________
Summary
“Normative data of transparency of pictograms ARASAAC: study with adult population“
The use of pictograms is common in work or therapy with people with complex communication needs (NCC), as well as in multiple situations of the daily life of many people. This study tries to obtain data from the ARASAAC graphic symbols by analyzing their transparency to achieve a standardized database with a normal population. In this study 41 adults participated, to whom 548 stimuli were presented per individual, out of the 1,644 total, which they had to assess on a 7-point scale based on their transparency. The results indicate that the pictograms used can elucidate efficiently.
Abstract
The use of graphic symbols is not unsual among therapist who work with people with complex communication needs (CCN), as well as in numerous situations in the everyday life of many people. The aim of this study is gather data of the ARASAAC graphic symbol’s validity analysing its transparency to achieve a scale data base with normal population.
In this study 41 adults participated, to whom 548 stimuli, of the total 1.644, were presented per individual. They had to value them in a 7 points scale according to its transparency. The results indicate that the graphic symbols used, can be elucidate in an efficient way.
Participants and experimental task
The sample obtained was extracted by non-probabilistic sampling for convenience. It therefore counted 41 Spanish participants, 17% men and 83% women. The age of the sample varied in a range of between 18 and 34 years, with a mean of 20.50 years and a standard deviation of 3.06. Most of them were university students of psychology, physics and master’s degrees, students of the University of La Laguna, and a minority of Bachelor’s studies. 50% of the sample had English as a second language. 50% of the sample had English as a second language.
In the present study, a methodology typical of this type of normative work was used, that is, the collection of subjective estimates on the translucency or degree of relationship of a pictogram and its verbal label. The development of the test was carried out in a classroom with multiple computers, through a web platform that
allowed the assessment of the pictograms gathered in 3 totally different sets, called Task 1, Task 2 and Task 3 with 548 different stimuli each. The duration ranged around 45-60 minutes. Their task was to pinpoint the perceived level of relationship between the pictogram presented on the screen and an associated verbal label. The stimuli were automatically presented and remained on the screen until the participant issued his response.
Conclusions
The main objective of this work was to obtain data on the degree of transparency, that is, the degree of relationship of a pictogram and its verbal label, through a scale and extract a normative distribution with which to baremar pictographic material.
The results make it possible to predict to what extent the database used may be interpretable enough to be considered transparent. Taking into account the minimum and maximum value of the graduated scale, these being the ends 1 and 7, we have a base of pictograms quite accessible in reference to their meaning. Descriptive statistics reveal an average base transparency of 6.06, indicating precisely that pictograms can be elucidated efficiently.
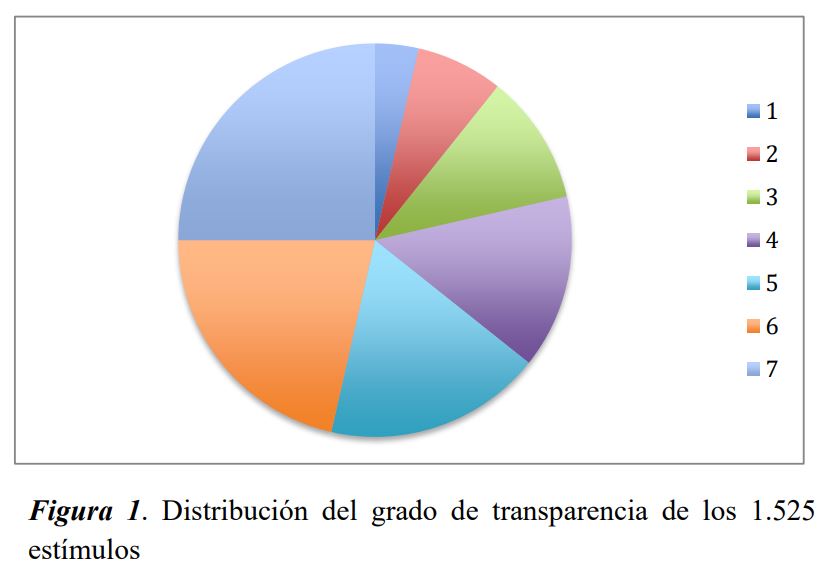
The standard deviation of 1.21 also reflects that most stimuli are tending to be well valued. In fact, of the 1644 items, 1533 had a score of 4 or more (from the average degree of relationship onwards), indicating that 93% of the pictogram base has an acceptable to perfect rating.